To Cut Delhi’s Air Pollution, Pinpoint The Source
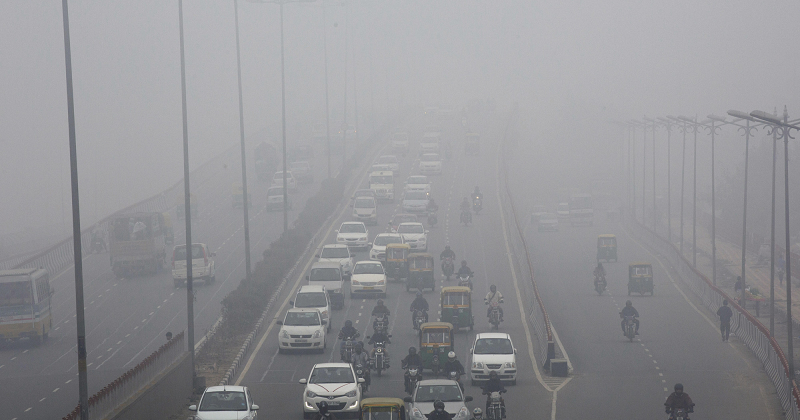
Recently, there has been a lot of concern and ensuing deliberations on the high levels of ambient air pollution in Delhi and other urban areas of India. This has prompted various authorities to propose some quick-fix solutions but they may not yield the desired results for a long term.

The just-concluded odd-even scheme in the city required motorists to find alternative means of transportation every other day. Car-free days, first in Gurgaon and then in Delhi, appeared to cause a temporary dip in pollution levels.
The first and foremost requirement to address air pollution at any given location is to correctly identify all major sources contributing to the pollution at that location. For this Indian Institute of Technology (IIT) Kanpur has released a long-awaited study that attempts to identify the sources of air pollution and inform the next wave of policies.
The new IIT-Kanpur study improves on previous attempts by taking seasonal variation in pollution into account, showing that vehicles are a much bigger contributor to air pollution in the winter than in the summer. The study also documents a broad range of sources like garbage burning, dust, and crop burning to paint a more complete picture of what’s causing air pollution in Delhi.
This study marks a good time for India’s regulators to implement a plan to commission these types of studies at regular intervals, using a regular set of metrics to track how pollution changes as the government intensifies its response.
Fine-grained data for a smart response
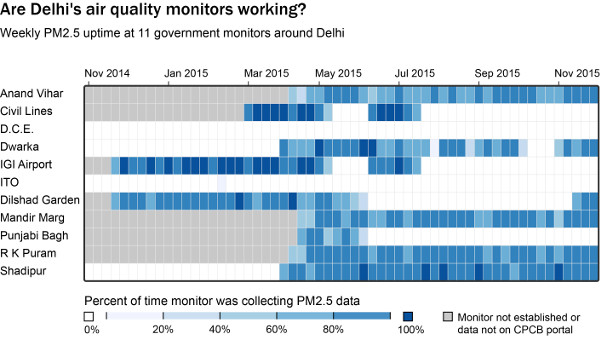
The backbone of Delhi’s air quality monitoring network is its set of 21 ambient air monitoring stations, 11 of which have data that are accessible to the public. The city’s main air pollution concern is PM2.5, suspended particles small enough to be trapped in the lungs. PM2.5 has been shown to cause lung cancer, cardiovascular and respiratory diseases, asthma, and a host of other health problems.
Data obtained from the Central Pollution Control Board (CPCB) website for the 11 monitors run by the CPCB and Delhi Pollution Control Committee (DPCC) show that PM2.5 was being recorded only 29% of the time at these sites last winter–the season associated with the most severe levels of particulate pollution.
Coverage since March 2015 has increased to 46%, but these gaps in the data make it difficult to reliably characterise the actual air quality situation in the city. Continuing the trend of improvement in coverage should be a high priority.

Coverage patterns show that monitor downtime tends to be concentrated in long stretches, when PM2.5 is not being collected for several months.
Making air pollution monitoring data easier for the public to access would be a good step toward creating the accountability that could help these organisations keep the city’s monitors functioning.
Search out the source:
There are two ways of conducting source apportionment studies: direct sampling based on chemical analysis, and secondary data analysis based on monitoring data. International best practice is to rely on receptor-based studies, but where budgetary constraints inhibit adequate sampling, analysis using secondary data may dominate.
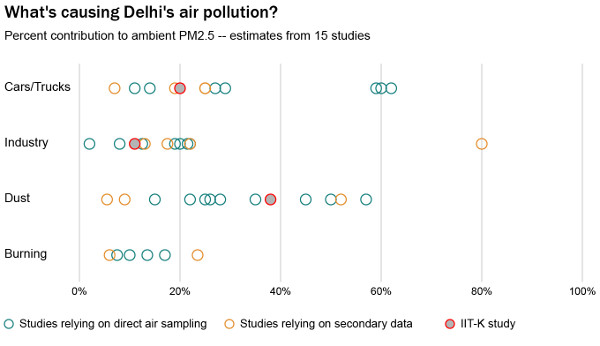
Over the past 10 years and excluding the just completed IIT Kanpur Study, we count 15 source apportionment studies that sought to pinpoint the sources of emissions and their respective contributions to Delhi’s overall air pollution. Ten are based on direct sampling; the other five rely on secondary data.
While the main sources identified are similar across studies, the relative weights placed on different sources by these studies vary dramatically. This underscores both the difficulty of conducting them and the wide range in quality of the studies currently available.

With even a rough idea of source apportionment, the government can take actions like shutting down dirty power plants and pushing neighbouring states to better regulate crop-burning.
However, Getting a reliable picture of air pollution is inherently difficult due to Delhi’s changing weather conditions and constantly shifting patterns of emissions throughout the day, week, and year.
Now is the time to get the information systems in place that will inform the next decade of environmental policy in the city, and beyond.